Table of Contents
- Brand new reporting and alerts dedicated sections in the Heimdal dashboard
- System Restore Management
- Cloud Access Security Broker (CASB) enhancements
- “Threshold” for identical Device Info notifications
- Reseller Master GP Alerts: Monitor GP Changes & Track Last Updated By
- Device Info – option to schedule a one-time reboot for hostnames
- ROI Report dashboard page enhancements
- Co-branding options for the Heimdal dashboard and reports
- Application Control – End user option for one-time process execution
- PEDM – Ability for the end user to extend the elevation time
- App Control – App Control rules priority awarding mechanism enhancements
- Email Security – Ability to view Email Processing History & Download .EML Files
- New filtering option “AI Outlier” in the ESEC and EFP Advanced Filter
- Brand new Remote Desktop app
- Addition of a new claim “Restrict impersonation of selected customers” in the Access Control list
- Ability to edit custom role names
- 3rd Party Patch Management, Non-stacked Assets view enhancement
- Guide, Customer Settings User Interface enhancement
- Zero-trust Execution Protection enhancements
- Addition of a Heimdal Deobfuscator tool
We would like to inform you that an updated version of the Heimdal Production dashboard, version 4.7.5, is now live.
Starting Friday, May 9th 2025, the Heimdal Prod. Agent will be available for download in the dashboard's "Guide" section under the "Download and Install" tab. It will be deployed on a roll-out basis over the course of the coming weeks.
Massive upgrades in store with the new version of the Heimdal Production dashboard, version 4.7.5 and we’d like to commence by presenting you those very ones:
Flagship Features
Heimdal Dashboard
• Brand new reporting and alerts dedicated sections in the Heimdal dashboard
Starting with this new Heimdal version, the reporting and alerting sections have been completely revamped, both structurally, as well as visually (design) and content wise.
A new, dedicated “Reports” section in now available in the left-hand side dashboard menu. From this section, the dashboard user can configure the desired reports and alerts and visualize the corresponding data. On top, with this new release, Heimdal users will be able to download the reports in .pdf format, at their convenience.
Note: the access to this new section of the Heimdal dashboard is regulated by Access Controls (claims), depending on the roles pertaining to the dashboard users. More info about reporting specific Access Control can be provided by Customer Support.
When accessing the “Reports” section of the Heimdal dashboard, the dashboard user will discover three tabs: Alerts management, On demand reports and Scheduled reports.
Alerts Management
The tab contains a grid having the following structure/ columns:
• “Customer” (specific for Reseller accounts only): displays the name of the customer for whom the Alert will be generated;
• “Recipients”: exhibits the e-mail address of the Alert recipients;
• "Alerts": dedicated columns, for each Heimdal product module, for which alerts can be generated;
• “Action”: contains two options, to either delete or edit an alert.
A “Search” field, allowing the dashboard user to conduct searches based on a specific recipient and/ or customer (depending on the dashboard user role) and a “Set up alerts” button, meant to allow customization of the alerts management flow.
Corporate Customer view
This view will list all Corp. Customer accounts with at least one alert enabled.
Reseller view
The Reseller view includes an additional “Customer” column and the option to filter based on customer name, via a dedicated search box.
In order to optimize UX, in case a certain customer has multiple recipients with the same alerts’ settings, we will display the recipients count in the dedicated cell, with an option to expand the entry, in order to visualize full details.
Generate new alerts entries
For both reseller and corporate customers, the “Set up alerts” button is available. When clicked, a modal window is displayed, allowing the user to select the customer (multi select type, displayed only for reseller accounts) and the product modules for which alerts are to be generated.
Note: if one or more product modules are not licensed, they will be displayed faded (non-alterable) in the set-up modal.
In the next step, the dashboard user is requested to select the alert recipient accounts and configure the customizations settings (time zone, date format, language and logo).
Grid view actions buttons column (Corp and Reseller)
As aforementioned, in the Alerts management tab grid, dashboard users can utilize the action buttons to edit or delete Alert entries.
When clicking on the “pen” icon, a user can edit the corresponding entry from the “Set up alerts” modal. The dashboard user can also delete the recipient by pressing the “trash bin” icon and then confirming the action from the corresponding pop-up window.
On demand reports
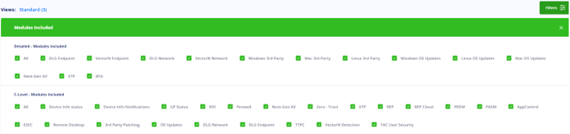
This tab is dedicated to report generation, filtering options, and data visualization for Detailed product (product modules) and C-Level reports (new addition to our reporting suite), for both Corporate Customer and Reseller type accounts.
While navigating the On demand reports page, Standard view, the Heimdal dashboard user will discover a table having the following structure/ columns:
• Report type: info related to the type of report that was selected (Detailed product report, C-Level etc.);
• Included modules: displays the abbreviated names of the selected product modules, for that particular report;
• Report start/ end date: showcases the selected timeframe for the report, in the "dd.mm.yyyy / dd.mm.yyyy" format (the timeframe is based on the logged in user time zone);
• Generated start/ end date: displays the report timeframe, in the "dd.mm.yyyy / dd.mm.yyyy" format (the timeframe is based on the report Customization Settings, Time zone selection);
• Timestamp: represents the date when the report was created by the user;
• Status: this column is displaying the status of the report (“Queued”, “Queue Failure”, “Processing”, “Failed”, “Success”) and, post the successful generation of the report, it will contain a download link, which, when clicked on will trigger the report download; if the status is "Queue Failure", a “Requeue” option will be available, allowing the dashboard user to attempt adding the report back to the processing queue;
Corporate Customer view
This view lists all the on demand reports generated at corporate customer level.
Reseller view
The Reseller view includes an additional column for Customer name and filtering by customer, via a dedicated search box found above the grid.
Filtering (Corp. Customer and Reseller)
Clicking the “Filters” button, will open a modal containing two sections: one related to detailed product reports and the other one related to the C-Level reports; in these two sections, the Heimdal dashboard user will be able to filter the data displayed on the grid based on the selection of the product modules that can be included in the two reports types.
A select "All" option is available for each report type in order to assist the user easily selecting/ unselecting all product modules.
Creating On demand reports
For the time being, the Heimdal dashboard user has the possibility of creating two different types of reports: C-Level and/ or Detailed product report (soon, more to come).
All types follow a step-by-step process.
Detailed product report.
• Click the “Generate on demand report” button. A modal window will open; select “Detailed product report” and proceed to the next step;
• Select the product modules to include in the report;
Note: available product modules for inclusion in the report are subject to Access Control, account type (roles), licensing options. For more details contact Customer Support.
• Configure report details (e.g.: date range, customization settings like time zone, language and logo). Resellers are required to select customers, as reports are generated individually for each selected customer;
Note: the maximum timeframe for report generation is 30 days; the corp. customer modal for report configuration is the same as the above, reseller one, without the “Select Customers” option.
C-Level report
• Click the “Generate on demand report” button. A modal window will open; select “C-Level report” and proceed to the next step;• Select the product modules to be included in the report;
• Configure report details (e.g.: timeframe, customization settings like time zone, language, logo and currency for the Return on Investment info). Resellers are required to select customers, as reports are generated individually for each selected customer;
Note: the maximum timeframe for report generation is 30 days; the corp. customer modal for report configuration is the same as the above, reseller one, without the "Select Customers” option.
Scheduled reports
This tab is dedicated to scheduled reports’ generation, filtering options, data visualization and the options to edit and/ or delete entries, for Detailed product report (product modules) and C-Level reports (new addition to our reporting suite), for both Corporate Customer and Reseller type accounts.
On the Scheduled reports page, Standard view, the Heimdal dashboard user will discover a grid having the following structure/ columns:
• Report type: info related to the type of report that was selected (Detailed product report, C-Level etc.);
• Included modules: displays the abbreviated names of the selected product modules, for that particular report;
• Timestamp: represents the date when the report was created by the user;
• Schedule: is showcasing the schedule information, based on the schedule type (Weekly, Monthly, or Occurrence);
• Scheduled by: displays the email of the user (account) who created the scheduled report;
• Recipients: displays the number of recipients; on mouseover, a tooltip that contains their email addresses, is shown;
• Action: contains two options, to either delete or edit a scheduled report;
• Checkbox column: allows the selection of one or multiple grid entries; if enabled, the “Select what action to take” drop-down list is displayed and provides the option to delete all the marked reports;
• Customer (Reseller specific column): displays the name of the corporate customer whom the report was generated for;
Corporate Customer view
This view lists all the scheduled reports generated at corporate customer level, with the ability to filter based on recipients (email addresses) by using a search box.
Reseller view
The Reseller view includes an additional Customer name column and option to filter by customer, besides the aforementioned filtering by recipient option, via a dedicated search box.
Filtering (Corp. Customer and Reseller)
Clicking the “Filters” button, will open a modal containing two sections: one related to detailed product reports and the other one related to the C-Level reports; in these two sections, the Heimdal dashboard user will be able to filter the data displayed on the grid based on the selection of the product modules that can be included in the two reports types.
A select "All" option is available for each report type in order to assist the user easily selecting/ unselecting all product modules.
Creating Scheduled reports
For the time being, the Heimdal dashboard user has the possibility of creating two different types of reports: C-Level and/ or Detailed product report (soon, more to come).
All types follow a step-by-step process:
Detailed product report:
• Click the “Generate scheduled report” button. A modal window will open; select “Detailed product report” and proceed to the next step;
Corp. Customer view
Reseller view
• Select the product modules to be included in the report;
Corp. Customer view
Note: available product modules for inclusion in the report are subject to Access Control, account type (roles), licensing options. For more details contact Customer Support.
Reseller view
• Select the corp. customers for which the scheduled report which the scheduled report is going to be generated for;
Note: This step is only for resellers user accounts, as reports are generated individually for each selected corp. customer sitting under that specific reseller.
• Select report recipient accounts (email addresses) and configure customization settings (time zone, language and date format)
Corp. Customer view
Reseller view
• Select the desired schedule: this step comprises of three options - specific week day selection, specific day (date) of the month selection, or an occurrence on which the user wants the report to be generated and sent and subsequently the recurrence (day, week or month level) with which this needs to happen going forward (for the day selection the minimum value is 7 and the maximum one is 30, while for week and month the minimum value is 1 and the maximum is 99);
Weekday selection
Day of month selection
Occurrence selection
Grid view actions buttons column (Corp and Reseller)
As aforementioned, in the Scheduled reports tab, Standard view grid, dashboard users can utilize the action buttons to edit or delete report entries.
When clicking on the “pen” icon, a user can edit the corresponding entry from the “Generate scheduled report” modal (except for some steps, like choosing the report type or selecting customers, in case the user account editing is reseller type). The dashboard user can individually delete one scheduled report by pressing the “trash bin” icon and then confirming the action from the corresponding pop-up window.
Users can also bulk delete Scheduled reports by selecting multiple entries from the grid, opting for the “Delete” action from the “Select what action to take” drop-down list and confirming the action from the corresponding pop-up window.
The above-mentioned steps (with slight variations) are to be followed for the C-level scheduled report generation too.
The Detailed product report is a product report showcasing detailed cyber security data (patched software, blocked domains, NGAV and XTP alerts, Brute Force attacks alerts etc.), from your estate, based on the selected product modules to be included in the report.
The content, remained the same as the “old”, Accounts section, per product module reports, but it is now displayed in a friendlier, more structured, versatile and relevant manner with a fresh new design, enhancing user experience.
The brand-new C-Level report is an executive, summary-type report, containing concise, relevant info related to the shape of your IT estate, displayed in a modern graphical manner. It is meant to give a “glimpse” overview, to diligent, high-ranking executives, being a “to the point” one stop shop when it comes to progress, compliance, risk overview and overall state of your cybersecurity environment.
It includes pivotal information ranging from Return On Investment, devices and users risk score, operational issues to the most pivotal, per product module cybersecurity metrics.
We are certain that you will enjoy the new, versatile, modern, yet relevant and practical reporting and alerting sections, helping you achieve an optimal cybersecurity posture, and staying compliant and safeguarded. In the short to mid-range future, you should expect more to come in this area, as well as continuously improved flows, content and enhanced visual quality.
● System Restore Management
The System Restore Management feature focuses on restore point creation, restore point automation, storage allocation and management, enabling you to maintain system stability and leverage recovery workflows in case of mishaps (e.g.: rolling back faulty or unstable Operating System updates).
In order to enable this new capability, you’ll need to go to Endpoint Settings -> click on a GP -> General -> System Restore Management tab and check the “System Restore Management” tick box (the System Restore Management checkbox is also found in the Patch & Assets -> Operating System Updates, Windows OS -> General Settings area).
Note: The System Restore Management module can retrieve the applications affected by a restore point only if the Patch & Assets module is enabled. When this module is enabled, the OS volumes will be automatically included in the checkpoint creation process.
We recommend maintaining the OS volume restore on reporting mode, monitor the created restore points and only then use the fully fledged/ “real life” functionality.
The System Restore Management tab contains the following configuration settings:
• System Restore Management - this option enables or disables the System Restore Management functionality;
• System restore reporting only – when enabled, Heimdal will not change the system settings of the device (if any checkpoint is available on the device, they will be retrieved);
• Create restore point before applying Windows Updates - this functionality is enabled only if the OS Updates module is enabled and not set in Reporting Mode;
• Data Volumes – if enabled, you will have the possibility of creating restore points for non-OS volumes;
• Schedule automatic point creation - this option enables automatic restore point creation based on the configured schedule;
• Assign disk space – allows you to assign the desired disk space percentage (slider) and have more control over the managed data volumes and the disk space they are using.
As previously mentioned, you are able to create automatic restore points by using a dedicated scheduler, based on specific weekdays, days (date) of the month and/ or recurring entries and during specific active or inactive time intervals.
When it comes to the dashboard/ product view, the System Restore Management functionality has its dedicated space in Products -> Operating System Updates, System Restore Management view. It provides an overview of all devices having restore points created.
The grid has the following structure/ columns: Hostname, Restore point name and Timestamp. The view also comprises of a search bar, enabling the dashboard users to search based on Hostname or Restore point name.
There is also a “Download .csv” option, allowing the data export in .csv format.
In order to apply restore points, the Heimdal dashboard user needs to select one entry from the grid. As soon as this is done, the “Select what action to take” drop-down list becomes available, together with the “Apply Restore Point” command.
Note: the selection of the entries from the table is a single select action.
Post choosing the “Apply Restore Point” command, the dashboard user gets redirected to the Client Specifics view -> UEM -> System Restore Management tab.
The System Restore Management tab consists of a single view, the Standard view, in which a table can be found with the following columns: Restore point name, Timestamp and Apply. In this view there is also a “Create Restore Point” button, which, when pressed, sends a command for the creation of a restore point, on the currently selected device, after action confirmation from the dashboard user.
Note: After hitting “Confirm” or “Cancel”, depending on the made choice, you will get a toast message, either confirming that the command was successful or mentioning that the command was not sent.
Applying Restore Points from Device Info -> UEM -> System Restore Management tab
If the dashboard user hits the icon from the “Apply” column, they will get a confirmation pop-up window corresponding to putting in application the corresponding restore point.
Note: A thorough review of potentially affected software (apps. and OS updates listed in the modal) is highly recommended before confirming and applying the restore point.
As previously mentioned, the System Restore Management functionality revolves around a dedicated server message type of commands, therefore the corresponding server messages can also be found in the Unified Endpoint Management -> Device Info -> Server commands view.
Similarly to other product modules related server commands, the ones tied to System Restore management (namely: OS Restore Create and OS Restore Apply, also added to the filters), can be cancelled (resolution “Pending”) or retried (resolution “Error’).
On the Heimdal Agent side, post an Apply Restore Point command is successfully sent, the endpoint receives it upon Heimdal Agent GP Sync. The end user is met with a pop-up message announcing the machine will be rebooting in 1 minute. This pop-up message is sent twice in order to avoid disruptions for the end user. After this time expires, the machine starts the restoration process.
Depending on the outcome of the System Restore action, when logging back in, the end user will either receive a successful restore confirmation pop-up message or an error one, as shown below.
Successful outcome
Unsuccessful outcome
Heimdal DNS Security – Network & Endpoint
● Cloud Access Security Broker (CASB) enhancements
The functionality of the previously known as “App Discovery” view, now denominated CASB, has been enriched with the addition, in both DNS Security – Network, as well as in DNS Security – Endpoint product modules, of the option to add applications, accompanied by their corresponding domains to the DNS Security blocklist.
The implementation of this feature implies the existence of a new Application blocklist, in Endpoint Settings -> DNS Security -> DarkLayer Guard™ tab, as well as in Network Settings -> DNS Security tab.
Note: The Application Blocklist works in conjunction with the Domains Blocklist; its rules are not applied and the option is inactive (greyed-out) if the latter is disabled.
The new table has two columns: Block application and the sortable Application Name column. There is also a Search field, which enables the dashboard user to search based on application name.
In order for applications corresponding to domains to be blocked, the dashboard users must check the Block Application option in the Application Blocklist table.
Note: The Domains Allowlist takes precedence over any blocklist. If a domain or application domain is blocked in the Application Blocklist and /or Block by Category list, but is also added in the Domains Allowlist, the domain in question will be allowed, and end users can access it.
In the Heimdal dashboard, Products -> DNS Security Network & Endpoint -> CASB (formerly known as App Discovery) a new column has been added, in order to accommodate checkboxes at row (app) level, which, when enabled, display the “Select what action to take” drop-down list, with the options to add or remove that specific app. to/ from the Application Blocklist and, implicitly, add/ remove its corresponding DNSs to/ from the Domains blocklist.
Post selecting a/ multiple application(s) from the list, in the CASB view, DNS Security – Endpoint and choosing the option to “Add to App Blocklist”, the dashboard user will be prompted with the selection (Enforce App Blocklist – force enables the App Blocklist in GPs where it is disabled and/ or the Domains Blocklist is disabled; Global App Blocklist – addition to App Blocklist in all the GPs and Custom Policy App Blocklist – addition only in specific GPs, based on selection) and confirmation modal window.
The Remove from App Blocklist action is also accompanied by a selection (Global App Blocklist – removal from all the GPs and Custom Policy App Blocklist – removal from specific GPs, based on selection) and confirmation pop-up window.
On the DNS Security – Network side, the add and remove to/ from App Blocklist options come along with slightly different confirmation modal windows, considering the Network vs. Endpoint differences between DNS Security – Network and DNS Security – Endpoint.
The confirmation pop-up window for addition of an app and its corresponding domains to the App Blocklist and subsequently Domains Blocklist provides only the option to Enforce App Blocklist (given that the app and domains are going to be added globally).
The confirmation pop-up window for removal of an app and its corresponding domains from the App Blocklist and subsequently from the Domains Blocklist looks like in the below screenshot.
Besides the afore-mentioned flagship features, in continuance, you are invited to discover the other main features and improvements rolling in with the new 4.7.5 PROD:
Heimdal Dashboard
● “Threshold” for identical Device Info notifications
As a natural follow-up enhancement to our 4.5.0 release, Device Info notifications flow complete overhaul, in order to provide more flexibility and versatility to our dashboard users, while keeping the notifications fatigue at bay (considering, also, the implications that this area has on the PSA Integrations feature) we give you the “Threshold” for identical notifications functionality.
This new feature, allows the Heimdal users to limit the number of identical Device Info Notifications generated within a specified time interval. This helps reduce redundant alerts and significantly improves notification management.
Note: The “threshold” functionality does not apply to the Heimdal Agent uninstall notification, given the security breach that could be generated in case this notification is not done when the uninstall occurs.
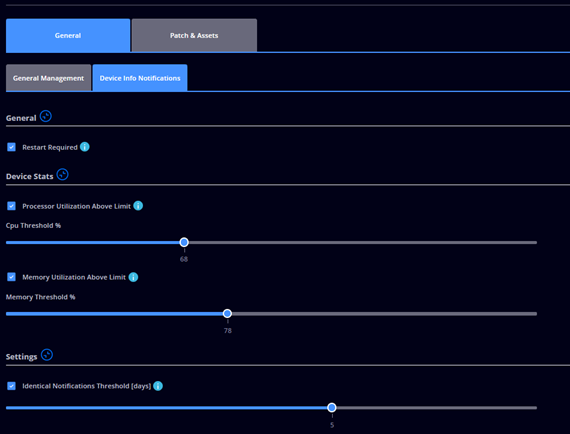
Users can now configure a threshold to control the frequency of identical Device Info Notifications. The interval can be set from 1 to 7 days, ensuring that repeated notifications are suppressed within the selected period. This can be achieved from the Endpoint Settings -> click on a Windows or Linux GP -> General -> Device Info Notifications tab, Settings section, by enabling the Identical Notifications Threshold checkbox.
Note: In order to manage the threshold, the Manage Endpoint Settings Area → Edit Device Info Notifications Endpoint Settings permission (claim), from the Accounts -> Access Control tab, must be enabled. If both Edit Device Info Notifications Endpoint Settings and View Device Info Notifications Endpoint Settings claims are disabled, the Device Info Notifications tab will appear as disabled, for both Linux and Windows GPs.
Additionally, the Linux notifications GP view (click on a Linux GP -> General -> Device Info Notifications tab) has been enhanced with collapsible sections, similar to the existing Windows view, leading to enhanced user experience (facilitating navigation and review).
● Reseller Master GP Alerts: Monitor GP Changes & Track Last Updated By
In addition to the 3.7.0 release, GP changes alert, launched almost two years ago, applicable only for “normal” GPs, in our efforts to continuously streamline the Group Policies management, we’re now launching a new GP management related alert, namely the “Reseller Master GP” one and enhancing the existing GP changes alert by adding the user who performed the last update and the corresponding timestamp.
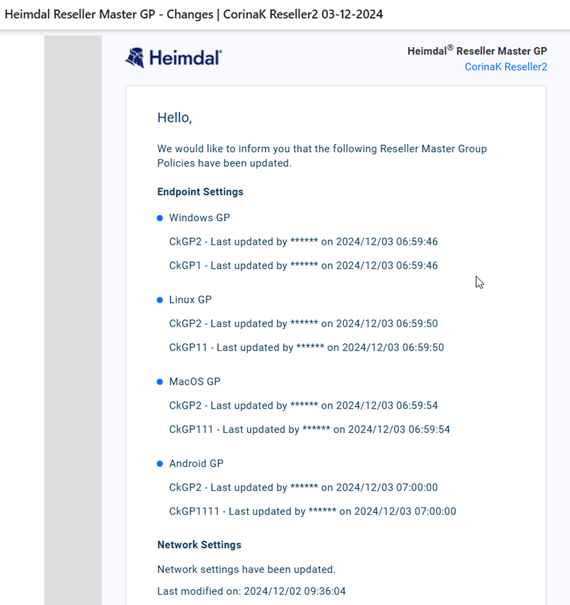
The brand-new Reseller Master GP Changes alert (available on all OSs) will allow our reseller role users to stay on top of modifications conducted to the GP that they have created.
Reseller users can now enable the Reseller Master GP Changes option from their user settings (Accounts -> Account Details (click on a reseller role account/ email address) -> Additional Alerts).
When enabled, they will receive a daily email report summarizing any modifications made to their Reseller Master GPs within the last 24 hours.
● Device Info – option to schedule a one-time reboot for hostnames
With the 4.7.5 release, a new option to schedule a one-time reboot for machines found in your IT estate has been introduced. In order to do so, you will need to navigate to the Unified Endpoint Management -> Device Info -> Standard view, select one or multiple hostnames and choose, from the “Select what action to take” drop-down list the “Schedule one-time reboot” command.
Note: if a hostname, on which a previous “Schedule one-time reboot” command has been applied, is selected again, the “Select what action to take” drop-down list will now include the “Cancel one-time reboot” option, meant to allow canceling the initial command.
After clicking the “Schedule one-time reboot” action, the Heimdal dashboard user is prompted with a modal window in which the date and time, as well as other reboot settings are to be configured.
In this modal window you will need to configure the following settings:
• Select date and time - allows user to select one day only, starting with the current date and the time (24h format) when the reboot is to take place;
Note: a validation is in place which does not allow the dashboard user to input the current hour, as the defined reboot time has to be in the future.
• Show reboot pop up – if the checkbox is enabled, a pop-up window warning will be displayed in the Heimdal agent to the end user whose machine is about to be rebooted, 10 minutes prior to the reboot;
Note: regardless of the options enabled in the scheduler, the Heimdal agent will always display a persistent warning pop-up window, 5 minutes before the reboot taking place, in order to avoid any disruptions for the end user;
• Allow reboot delay – if enabled, it will allow the dashboard user to select the number of minutes and number of postpones allowed (dedicated sliders), which are to be applied on the initial reboot settings;
Note: in order for this option to be available show reboot pop up should be enabled.
After the reboot settings are defined and confirmed, a new server command "Schedule one-time reboot" is created and sent to the agent. This will be displayed in the Unified Endpoint Management -> Device Info -> Server Commands view.
The resolutions corresponding to the newly added server command are:
• Pending - request sent to Agent;
• In progress - request received by the Agent, execution in progress;
• Completed - successfully executed;
• Cancelled - command cancelled;
• Error - could not be executed, when hovering over the resolution, an info bubble is displayed with the reason for the failure;
The Server Commands view filter has been updated with the new command type (“ScheduleOneTimeReboot) allowing the dashboard user to easily filter the data displayed on the grid.
● ROI Report dashboard page enhancements
This implementation brings changes to the layout of the existing ROI Report dashboard page (Unified Endpoint Management -> ROI Report), while also adding new product modules’ tiles and cost estimates for the cost saved while using the Heimdal solution.
The cost summary was moved from the right hand side to the top of the page and displays tiles representing the product modules breakdown of the ROI Report.
For sections which contain multiple graphs (product modules having submodules), a breakdown of the cost saved can be seen by clicking the chevron. The header displays the total, per product module, cost saved, on the right hand side of the summary header.
● Co-branding options for the Heimdal dashboard and reports
Starting with the 4.7.5 release, our Corp. Customers and Partners (Resellers) will have the option to add their visual identity (logo) to our dashboard and to the alerts and reports, thus creating bespoke content for their users.
In this regard, a new tab, called Company Info was created in the Guide -> Customer Settings section of the Heimdal dashboard. In this tab, the dashboard user (Corp. Customer or Reseller role) will be able to upload their company logo.
The uploaded file should be an image file type (PNG, JPG, etc.) and, ideally, have a transparent background in order to achieve the best visual outcome.
A small logo preview is available in the section, as well as the option to download or delete the logo.
Once uploaded, the new logo will be displayed, in conjunction with the Heimdal logo, on the Heimdal dashboard login page, on the Dashboard’s main/ left-hand side menu and in the alerts and reports templates.
Note: Each Dashboard user (reseller or corp. customer role) will always see on the login page and in the Dashboard’s main menu, the logo belonging to its own customer, regardless of the impersonated customer (e.g.: if a reseller uploaded a custom logo, all user accounts belonging to that reseller will see the reseller logo).
When generating/ editing reports or setting up alerts, the dashboard user can select the logo to be displayed on the template: “Custom logo when available” or Heimdal logo. The logo selection is available in the Customization Settings modal window:
Note: the custom logo used will depend on the level at which the report/ alert is set; if a report/alert is set at reseller level, then the reseller logo will be used; if a report/ alert is set at corp. customer level, then the corp customer logo is used; regardless of the level on which the report is configured, if "Custom logo" is selected, but no logo is available, the system will always default to using the Heimdal logo.
Heimdal Privileges & App. Control
● Application Control – End user option for one-time process execution
This new feature gives the Heimdal end users the ability to request a one-time execution for a specific process that was intercepted and blocked (by default or by any specific App. Control rule) by our App Control module.
This ability will be regulated by a check box called “Run non-elevated file” found in the Endpoint Settings -> Privileges & App Control -> Application Control tab, General Settings section.
Note: The visibility of the new checkbox is subject to PEDM licensing (if PEDM license is enabled, the checkbox is visible, regardless if the PEDM module is enabled or not in that specific GP). In case PEDM is not enabled in the GP, the “Run non-elevated file” tick box will be visible, but non alterable.
If enabled, as soon as an application was intercepted and blocked by an App Control rule, in the agent pop-up window, displayed to the end users, we will have two new buttons: one to request a file elevation in PEDM and one to request a one-time file execution, without administrator privileges.
Also, when the “Run non-elevated file” checkbox is enabled, the “Auto-mode” sub option becomes alterable/ active (default state disabled). When the “Auto-mode” setting is enabled, the execution of any blocked application will start right away, without the IT admin needing to provide a manual approval, from the PEDM -> Pending Approvals view (in case PEDM is configured to require a dashboard approval).
On the agent side, we have updated the popup that is displayed when App Control intercepts and blocks any application, either by default or by specific App Control rule, and will, from now on, display up to 2 buttons, depending on the Endpoint Settings configuration.
If PEDM is enabled from GP and “Run as Administrator” is on, in the left hand side we will have a button named “Run as admin”. Once the button is clicked, it will trigger a file elevation flow, creating a request in PEDM (based on the PEDM set-up – reason required or not, approval required or not, reason length, local token elevation, etc.).
The file will bypass the App Control ruleset, whether “Privilege Elevation and Delegation Management to bypass the ruleset” is enabled or not, in the Application Control tab from Endpoint Settings.
If “Run non-elevated file” is enabled from the App Control GP, on the right hand side of the pop-up window, we will display a button called “Run”, that once clicked, will create a file execution request that will be sent for approval (or will start right away, if “Auto-mode” is on in GP) in PEDM -> Pending Approvals, dashboard view. If approved or started right away, the file will be executed without administrator privileges and only one time. Like on “Run with Admin Privileges” button, the ruleset will be bypassed.
With this implementation the PEDM workflow was also updated, in order to consider file elevation requests created from the App Control agent pop-up and to bypass the entire App Control ruleset for this kind of elevations, no matter of the Endpoint Settings status of the “Privilege Elevation and Delegation Management to bypass the ruleset” functionality.
In the Heimdal dashboard, Pending Approval view, we have updated the status for file elevation and file execution requests, to create a clear distinction between these two request types.
From now on, any file elevation request (“Run with Admin Privileges”) will have the status “Elevation requested”. Any one-time non-elevated execution request coming from the “Run” button, in agent pop-up, will have the status “Execution requested”.
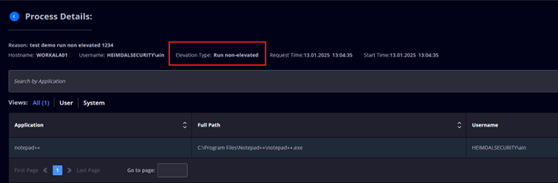
Additionally, in the PEDM History view grid a new column called “Type” was added, in which we make the distinction between requests, considering the type: administrator session request, file elevation request or a file execution request triggered by the “Run non-elevated file” functionality.
The addition was also made in the “Process Details” view (redirection after clicking the number of executed processes).
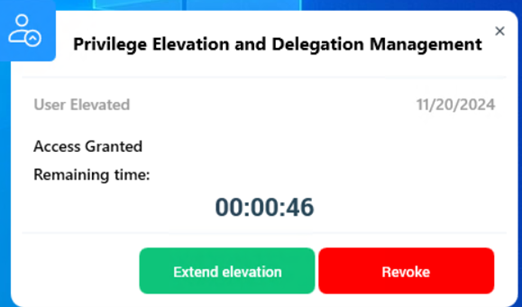
● PEDM – Ability for the end user to extend the elevation time
This new PEDM feature enables end users to extend the duration of the elevation. The setting can be configured from Endpoint Settings -> click on a GP -> Privileges & App Control -> Privilege Elevation and Delegation Management, Administrator Session section, “Allow end user to extend the Administrator Session length” check box.
When enabled, the settings for 'Extended session length' and 'Number of admin rights extensions allowed' become active/ alterable.
The "Extended session length" slider is used to define the duration, ranging from 2 minutes up to 60 minutes, which the elevation can be extended for.
“Number of admin rights extensions allowed" slider specifies the maximum number of extensions permitted to the end user (maximum 5).
In the Products -> Privileges & App Control -> PEDM -> History view, Administrator Session elevations that were extended, will be marked with an info bubble, placed next to the timestamp from the “End Time” column, indicating the number of times the elevation was extended.
On the Heimdal agent side of things, a pop-up window will appear (in case the “Allow end user to extend the Administrator Session length” check box is enabled) one minute prior to the session elevation end. It includes a green button labeled “Extend elevation” that, when pressed, will extend the elevation based on the GP settings.
● App Control – App Control rules priority awarding mechanism enhancements
This App Control flow enhancement addresses the issue of priority awarding for duplicate rules when updates are taking place at Custom Group Policy update and Global update levels.
Previously, if an Application Control rule was created in one Group Policy and the update was applied to other Group Policies, a duplicate priority could occur. If a rule with the same priority as the newly added rule already existed in those policies, the update would still add the new rule, resulting in duplicate priorities.
Below is a brief explanation of what happens for each rule action:
• Adding a new rule
When adding a new rule and propagating it to other Group Policies, starting with the 4.7.5 Production release, we will conduct an extra check, verifying if a rule with the same priority, subject, and rule type already exists in the target Group Policies:
- if the priority already exists, it will be incremented to the next available maximum priority;
- if the combination of subject and rule type already exists, the new rule will not be applied to that/ those Group Policy/ Group Policies;
• Updating an existing rule
When updating a rule and propagating it to other Group Policies, the original rule (before any changes) is removed, and a new rule is added.
• Deleting an existing rule
When deleting a rule and propagating the deletion to other Group Policies, the rule will be removed if the subject and rule type match an existing rule in the target Group Policy/ Group Policies.
Heimdal Email Protection
● Email Security – Ability to view Email Processing History & Download .EML Files
Starting with the 4.7.5 PROD release, as testimony to our continuous effort to improve our customers’ reporting capabilities and compliance norms, we’ve introduced in our Email Security product module new information fields in the Advanced tab and a download option in the Body tab, from the Details section.
These improvements provide greater visibility into the initial classification and server responses of emails, along with the ability to download email content for further analysis.
When going to Products -> Email Protection -> Email Security ->Details and clicking on the Details button, pertaining to an email from the grid, the Heimdal dashboard users can now find new info in the Advanced tab, info related to the Initial Status of the email and the Initial Responses from server.
Also, a new option, found in the Body tab, namely, to download the .eml file has been made available.
Note: In order to access the Body tab, the Manage Email Protection Data → View Email Security Sensitive permission (claim) must be enabled. Otherwise, the tab will appear disabled. Also, to ensure emails (.eml files) can be downloaded, email retention must be set up before the email is received.
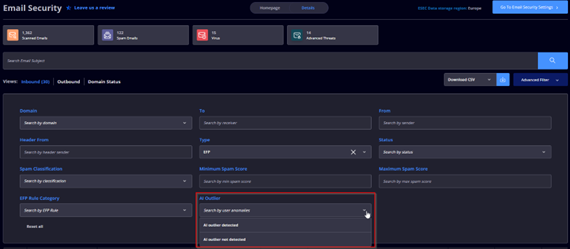
● Email Security & Email Fraud Prevention – New filtering option “AI Outlier” in the ESEC and EFP Advanced Filter
This release introduces a new drop-down “AI Outlier” filter in the Advanced Filter section of both ESEC and EFP product pages (Details), allowing users to filter emails based on AI-based anomaly detection (“AI Outlier detected” – displays email flagged as anomalies and “AI Outlier not detected” – displays email not flagged as anomalies, being the two filtering options).
Heimdal Remote Desktop
● Brand new Remote Desktop app
In order to provide more versatility and convenience to our Remote Desktop user customers, starting with this release, a completely new, in-house built, Heimdal agent – independent, Heimdal Remote desktop application will be available.
The app is delivered in the shape of an executable file that can be downloaded from the Guide -> Download and install tab of the Heimdal dashboard.
With the new app a new connection flow will be available: the end user will trigger the connection request by generating the connection credentials which are to be used by the Supporter in order to join the remote desktop session.
In order to connect to a remote desktop session triggered from the Heimdal Remote Desktop app, the Supporter will need to go to the Heimdal Dashboard -> Products -> Remote Desktop, Standard view, press on the "Connect to remote session" button and insert the credentials (Remote ID and Password) generated in the app.
Note: in order to connect to a remote desktop connection generated from the Heimdal Remote Desktop app., the Supporter will need to have the Heimdal RD viewer executable installed and running.
The Remote Desktop app. has the following functionalities:
- Refresh Password: changes the Password;
- Copy to Clipboard: copy the Remote ID and Password;
- Remote ID: which is unique for each user;
- Password: can be changed;
-
Connection status - displays the status of the connection:
- Available - a connection can be established;
- Pending connection - a connection is in progress to be established;
- Connected - the connection was established;
- Offline - the PC has no internet connection;
- Contact Support: opens the Heimdal Support page;
Other improvements & fixes
● Addition of a new claim “Restrict impersonation of selected customers” in the Access Control list
As an enhancement related to impersonation management, with the end goal of tightening security and increasing compliance levels, the introduction of this new claim, for reseller role Heimdal dashboard users, ensures that, based on need, reseller accounts can only impersonate authorized corporate customers, preventing access to restricted accounts while still maintaining the flexibility given by the existing impersonation functionality.
The IT Administrator can enable the new claim called “Restrict impersonation of selected customers”, from the user settings space (Accounts -> Account details/ click on an account -> Access Control tab). Once enabled, a multi select pre-filled list of the corp. customers, sitting under the specific reseller to which the user belongs, is used to choose the corp. customers that the given reseller account won’t have rights to impersonate.
Note: In order to use the “Restrict impersonation of selected customers” claim, the reseller user account needs the “Impersonate customer” claim to be active, as a pre-requisite.
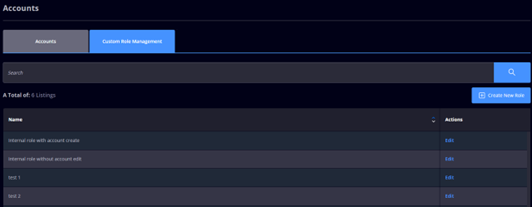
● Ability to edit custom role names
Small, yet useful enhancement, we are now providing the option to rename custom roles in the Custom Role Management section. This improvement provides greater flexibility in managing existing roles by allowing the editing of an existing custom role name, without the need to recreate a new one.
When navigating to the Accounts -> Custom role management tab, the dashboard user has the option to change the name of an existing custom role, by clicking on the Edit button, entering the new role name in the text field and hitting the “Update role” button.
● 3rd Party Patch Management, Non-stacked Assets view enhancement
Improving software tracking and reporting can play a pivotal role in achieving compliance. That’s why, starting with the 4.7.5 Production release, we’ve replaced the “Date” column (timestamp when the app. was detected by the Heimdal agent), from the 3rd Party Patch Management, Windows OS, Assets, Non-stacked view with an “Installed date” column, in order to provide crisper insights into when applications have been installed.
Note: the same change was conducted in the Non-stacked Assets View, Stats visualization (when clicking entries from “By CVSS” pie chart or “By release date” matrix), Infinity Management –> Software Asset Management tab (clicking on app. name -> Discovered Assets tab) and Unified Endpoint Management -> Device Info tab, Client Specifics (clicking a hostname) -> Patch & Asset Management -> Asset Management tab.
● Guide, Customer Settings User Interface enhancement
Streamlining user experience and providing ways to easily work in the Heimdal dashboard has been one of the Heimdal goals from the early days. In this regard, with the 4.7.5 Production release, you will discover visual and logical improvements that took place in the Guide -> Customer Settings tab of the Heimdal dashboard.
Two new stand-alone tabs, “Azure AD Sync” and “PEDM Primary Users”, were added, along with modifications to the existing “Login Setup” tab.
1. Login Setup tab -> Azure Login sub tab
In this space, the “Azure AD Sync setup” and “Primary Users Sync setup” sections were removed. The tab will now contain only the SAML 2.0 login related checkboxes, the Tenant Id field and the Update button.

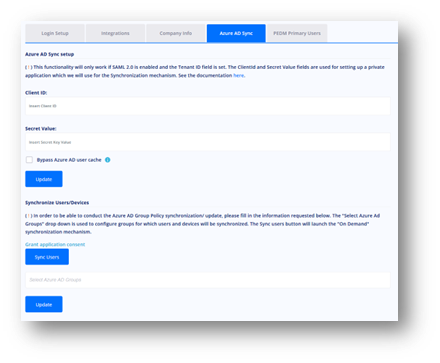
2. Azure AD Sync tab
The newly created tab, consists of exactly the old content included in the Login Setup -> Azure login sub tab, except for the Tenant Id field, which remained in the Login Setup tab -> Azure Login sub tab.
3. PEDM Primary Users tab
The old “Primary Users Sync setup” section, from the Login Setup -> Azure login sub tab, has been moved to this dedicated tab.
● Zero-trust Execution Protection enhancements
Rolling out with the 4.7.5 Production release are two Zero-trust Execution Protection enhancements, namely.
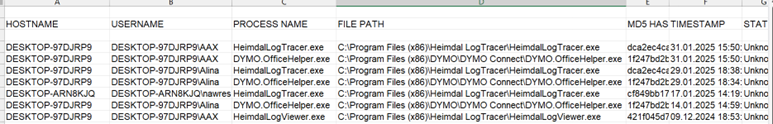
1. Addition of the file path info in the .csv export of the Zero-trust grid.
The info, previously displayed on mouse over on the Process Name column, can now be found in the dedicated .csv file, consolidating reporting and forensics capabilities.
2. Enrichment of the exclusions criteria.
These can be performed, starting with the 4.7.5 Production release, on a wildcard basis too (besides the existing: file name & path, directory and MD5).
Also, in order to make reporting more efficient and diminish alert fatigue, we’ve aggregated the Zero-trust execution protection email alerts which, going forward, will be sent every hour (in case new detections have occurred since the last email alert).
● Addition of a Heimdal Deobfuscator tool
In order to assist our users in their forensics endeavors related to Next-Gen AV quarantined files, we’ve added a dedicated deobfuscation tool, which can be downloaded from the Guide -> Download and Install tab of our dashboard.
No installation is needed, the app. can be used at once in a very straightforward manner. The Heimdal Deobfuscator UI consists of two browsing options and an Export button that decrypts the file.