In this article, you will learn everything you need to know about the device information view of each particular endpoint. This view can be accessed by logging into the HEIMDAL Dashboard, clicking on Unified Endpoint Management -> Device Info on the left sidebar, and then clicking on any device in the list.
1. UEM
2. DNS Security
3. Patch & Asset Management
4. Endpoint Detection
5. Privileges & App Control
6. Remote Desktop
7. TAC
UEM
DEVICE INFO
In the UEM tab, you see several sub-tabs: Device Info, Logs, BitLocker Management, Scripting, USB Management, and System Restore Management. The Device Info view displays basic information related to endpoint identification (chassis, hostname, username, last seen, IP Address, external IP Address), hardware (bios version, manufacturer, motherboard serial, motherboard manufacturer, model, CPU, Memory, Disk serial, Disk capacity, and Disk usage), operating system (edition, version, full version, build version, service pack, original install state, and Last reboot [updated every 60 minutes]) and HEIMDAL product status.
The data is being updated on each dataset as follows:
- Username, Last Seen (refreshes every 6 hours), IP Address, Memory usage (every hour).
-
Disk usage (it's the arithmetic mean of the I/O operations of the last 24 hours).
- Disk capacity (the size of the System drive).
- VDF Version and Timestamp (updated every 120 minutes locally and refreshed every 60 minutes).
- DNS Information (every hour).
- Enabled modules (every hour).
LOGS
The Logs view allows you to see the Status History and request the Heimdal Logs, the Event Viewer Logs, the Remote Desktop Logs (for those with Remote Desktop on their license), and quarantined or intercepted files from the endpoint. The log files or the detected files are usually uploaded to the HEIMDAL Dashboard on the first Group Policy check (according to the Group Policy check interval configured in the applying Group Policy) after being requested.
The Windows Event Viewer logs have a Type column that allows the dashboard users to distinguish between Full Event Viewer Logs that are uploaded manually and Security Logs that are uploaded automatically by the Automatic Security Logs retrieval functionality.
Status notifications
To have a better overview of the status of your endpoints/devices, track their usage, or see what situations require manual intervention, we've come up with a list of warnings and notifications that should give you an understanding of each scenario:
- The processor is running at 50 % - the CPU usage exceeds the limit configured in the applying Group Policy on CPU Threshold. To solve it, reduce the CPU usage on the endpoint/device itself or increase the CPU Threshold limit in the Group Policy.
- The memory is running at 60 % - the Memory usage exceeds the limit configured in the applicable Group Policy on Memory Threshold. To solve it, reduce the Memory usage on the endpoint/device itself or increase the Memory Threshold limit in the Group Policy.
- The disk is running at 90 % - the disk usage (I/O operations) exceeds 90% (default limit). To solve it, close some of the processes that cause high disk usage.
- An update has started! - the HEIMDAL Agent has initiated a self-update operation to update itself to a newer version.
- Heimdal Agent has been uninstalled - the Heimdal Agent has been removed from the endpoint.
- This PC has a risk of DNS poisoning - a third-party tool is attempting to 'hijack' the DNS IP addresses by removing Heimdal's DNS settings and replacing them with others. Please note that this message may also appear if you manually override Heimdal's DNS addresses.
- DarkLayerGuard was disabled by the Uptime Checker. - the DarkLayer Guard engine is trying to 'hijack' the DNS IP Addresses configured on the NICs (to replace them with our loopback address), but for some reason, it is not completing the operation. This can happen due to an incompatibility between our product and another (security) product (like a VPN) that alters or changes the DNS IP Addresses on the NICs.
- DLL hijacking detected and stopped (...). - As they start, the DarkLayer applications or services are looking for DLL (Dynamic Link Libraries) files to function correctly. When these DLLs are not found or are implemented insecurely, the application can be forced to load and execute malicious Dynamic Link Libraries. For this kind of situation, HEIMDAL Security will detect and block any changes made in the locations where DLLs are stored.
- Peer2Peer server failed to start - the functionality could not be initiated on the machine designated as the P2P server.
- A reboot is in progress on this machine to install one or more Microsoft Updates. When at least one Windows Update that requires a reboot has been installed and the system is shut down afterward, the notification message will be displayed if the endpoint/device does not return actively within 7 days. This warning also triggers an email alert to the HEIMDAL Dashboard Administrator (with Alerts enabled) to inform them about the endpoint that has not come back online.
- The machine needs a reboot to complete the Microsoft Update. - Whenever a Windows Update that requires a reboot is installed, the notification is displayed until the computer is rebooted and communicates with our HEIMDAL servers.
- There was an error when fetching available Windows Updates. HRESULT: 0x80072EFD. - the HEIMDAL Agent tried to install a Windows Update but failed due to the displayed error: HRESULT 0xYYYYZZZZ. Running the Windows Update troubleshooter on the endpoint itself should solve the issue or give more information.
- The available Microsoft Updates collection has been empty for more than 20 days - the Heimdal Agent has been unable to find any new updates during this period. This typically indicates a problem with the Windows Update service on the local machine.
- Action required: for Heimdal™ Next-Gen Antivirus & MDM to work, please uninstall the following antivirus product(s): ... - another Antivirus product is being detected on the endpoint/device, and it conflicts with the HEIMDAL Next-Gen Antivirus & MDM. Two antivirus products cannot work correctly on the same endpoint/device, and that is why we recommend having only one. When it comes to Windows Defender, our product will automatically disable it and take it over to Security Center to offer a true Next-Gen security solution. Although the detected antivirus product has been uninstalled, it might still be detected due to the registry leftovers in the WMI. To solve it, you need to reset the WMI (HEIMDAL Security Support can assist with this process);
- Could not update antivirus definition files. - The antivirus definition files failed to update on the endpoint. To solve the issue, reboot the endpoint and check the VDF Version and Timestamp to see if it got updated. If not, please reach out to the HEIMDAL Security Support Team.
- Could not detect a functional firewall on this device. It is recommended to install one. - the HEIMDAL Agent is checking for a firewall solution (Windows Firewall), but is unable to find it and activate it;
- Please restart your computer to finish the installation. - the HEIMDAL Next-Gen Antivirus & MDM requires a reboot to complete the installation of the Antivirus drivers.
-
There are incompatibilities between GPO (Windows) Firewall setup and Heimdal Firewall (GP) settings! - This notification informs the Dashboard users that their Firewall is not handled by the HEIMDAL Agent, as it is currently handled by a Local Policy that was configured via Active Directory. Due to how the Windows Firewall functions, when an endpoint is configured via Local Policy, it makes it unable for the HEIMDAL Agent to perform an isolation action. As long as an EnableFirewall property is found under any key in HKEY_LOCAL_MACHINE\SOFTWARE\Policies\Microsoft\WindowsFirewall, the HEIMDAL Agent will display the notification.
These notifications are also displayed at the machine level in the Device Info -> Standard/Hardware views, under the Status column. If the CPU or memory usage median values exceed the threshold configured in the Group Policy, you will receive a notification, as shown below.
DNS Security
DARKLAYER GUARD™ ENDPOINT
The DarkLayer Guard™ Endpoint view will log any threat detected by this module. Here you will find the user under which the detection happened, and the source of the threat (under which you can also click for more forensic information![]() , check VirusTotal's database
, check VirusTotal's database![]() , or find the IPs, URLs, and domains considered a threat in that particular case
, or find the IPs, URLs, and domains considered a threat in that particular case![]() ). The view supports categories so you can filter based on prevented attacks, allowed domains/processes, or all detections regardless of status. Once you have navigated to the hostname view, you will notice you can access all active Heimdal modules for detailed information collected about that specific host. On the top of the screen, you can even take direct actions on the endpoints based on the Heimdal modules you have purchased and activated on the Group Policy associated with the endpoint. The pre-filtered views here are all structured the same way but contain different information. All Statuses view combines the information from Prevented Attacks, Allowed, and Analyzed in one place. You can use the status indicator to the left to tell them apart. The Prevented Attack view is where the threat hunters can analyze all blocked Domains and correlate them with the associated threat type and process used. This will help a Security Analyst plan steps to remediate and proactively stop any emerging infiltrations before they gain persistence. The Allowed view will let a security team gain an overview of what domains were sent to the cloud for further analysis, but ended up being deemed legitimate. The analyzed view is a combination of Prevented Attacks and Allowed data, giving a full overview of everything sent from the endpoint to the cloud for analysis, no matter what the result was after. On the Category Blocks view, it is easy to dive in and get a full overview of how the specific users' online behavior mismatches with the organization's decided guidelines. This makes it easy to know where further training should be prioritized to keep all users on hygienic online behavior.
). The view supports categories so you can filter based on prevented attacks, allowed domains/processes, or all detections regardless of status. Once you have navigated to the hostname view, you will notice you can access all active Heimdal modules for detailed information collected about that specific host. On the top of the screen, you can even take direct actions on the endpoints based on the Heimdal modules you have purchased and activated on the Group Policy associated with the endpoint. The pre-filtered views here are all structured the same way but contain different information. All Statuses view combines the information from Prevented Attacks, Allowed, and Analyzed in one place. You can use the status indicator to the left to tell them apart. The Prevented Attack view is where the threat hunters can analyze all blocked Domains and correlate them with the associated threat type and process used. This will help a Security Analyst plan steps to remediate and proactively stop any emerging infiltrations before they gain persistence. The Allowed view will let a security team gain an overview of what domains were sent to the cloud for further analysis, but ended up being deemed legitimate. The analyzed view is a combination of Prevented Attacks and Allowed data, giving a full overview of everything sent from the endpoint to the cloud for analysis, no matter what the result was after. On the Category Blocks view, it is easy to dive in and get a full overview of how the specific users' online behavior mismatches with the organization's decided guidelines. This makes it easy to know where further training should be prioritized to keep all users on hygienic online behavior.
DARKLAYER™ GUARD NETWORK
The DarkLayer Guard™ Network view will log any threat detected by this module. Here you will find the IP address and domain associated with the respective attack, the type, and also the timestamp of each threat. The view can also be filtered to show more relevant results depending on the case needed.
VECTORN DETECTION
The VectorN Detection™ view shows you all of the detections made by this product. Here you will be shown the malware pattern detected, the probability of further infection, how many times the detection occurred, the process bearing the malware infection, and the last time it was detected. Upon selecting one or more detections, you can choose to quarantine the files or hide the detection altogether from the action menu.
VECTORN DNS-N DETECTION
The VectorN DNS-N Detection™ view shows you all of the detections made by this product. Here you will be shown the malware pattern detected, the probability of further infection, how many times the detection occurred, and the last time it was detected.
PATCH & ASSET MANAGEMENT
3ʳᵈ PARTY PATCH MANAGEMENT
The 3ʳᵈ Party Patch Management tab shows information about the software on the endpoint that is monitored and patched. Apps can also be hidden if they do not present an interest. Here you can see the view based on a chronological log of the status/patches (Latest Status/Latest Patch). Presented information includes the name and version of each application logged, any CVE and CVSS information if available, the last update date, and whether the update was successful or not.
The Currently and Historically considered vulnerable software are categories that show which software is and was considered vulnerable, based on the latest version compared to the currently installed one, CVE/CVSS information, and the date of the check.
The Up-to-date view is a filter of the Latest Status view, in the way that it shows all the software that has the latest version installed, along with the version, CVE/CVSS information, and the timestamp.
The Uninstalled view shows software that was uninstalled recently on the respective machine.
OPERATING SYSTEM UPDATES
The Operating System Updates category parses information about patches to the Windows OS. Here, you can sort to see Installed, Pending, or Available updates, as well as hide them from any of the views. These views show the KB from Microsoft, the severity rating, CVE/CVSS information if available, products for which the updates apply, and whether a reboot is necessary for available and pending updates.
The Compliance View will show you if the endpoint is compliant or non-compliant at the date of the check.
ASSET MANAGEMENT
The Asset Management category shows all the software found on the computer and offers information on whether each specific software is supported and/or uninstallable by the HEIMDAL Agent, as well as actions to add that software to a Group Policy or uninstall it, along with the version information for each entry. The view can be further filtered for monitored-only (or not) software.
ENDPOINT DETECTION
DETECTED THREATS
The Detected Threats category under Endpoint Detection offers respective information regarding infections on the machine. Here, detected files can be quarantined, deleted, excluded, or uploaded to the Dashboard for the support teams to review if needed (by checking the files and clicking Upload to storage in the actions menu). The parsed information includes the file name and its MD5 hash, the threat name and its type, the status of the infection, and the timestamp of the detection.
QUARANTINE
The Quarantine category covers the contained infections. Here, quarantined files can also be deleted, excluded, or uploaded to the Dashboard for the support teams to review if needed (by checking the files and clicking Upload to storage in the actions menu). The parsed information includes the file name and its MD5 hash, the threat name and its type, the status of the infection, any resolution taken, if available, and the timestamp of the detection.
SCAN HISTORY
The Scan History view will show logs of each scan that was performed on the machine, with details such as scan type, elapsed time and if any infections were found, and the resolution for each.
FIREWALL RULES
The Firewall Rules tab shows what rules are currently enforced on the machine by the current Group Policy, which can further be filtered by allowed or blocked applications. Here, you can also see for each entry, the ports and protocols of the rule, and whether the rule specifies the communication as inbound or outbound.
FIREWALL ALERTS
The Firewall Alerts tab will log any detections made by the Firewall and will show the count of attempts per username and per IP Address.
RANSOMWARE ENCRYPTION PROTECTION
The Ransomware Encryption Protection views will log activity in this respect. Here you can see the process and its ID, the username, and the reason for blocking. If you select one or more entries, you can also exclude them or upload them for analysis.
Moreover, each entry contains links to VirusTotal's database, but also a Forensics analysis that will tell you more about the specific detection's patterns, relations, and behavior.
ZERO-TRUST EXECUTION PROTECTION
The Zero-Trust Execution Protection views will log the activity of this product. Here you can see the process and its MD5 hash, the username it ran from, and the timestamp. If you select one or more entries, you can also exclude them or upload them for analysis.
PRIVILEGES & APP CONTROL
PRIVILEGED ELEVATION AND DELEGATION MANAGEMENT
The Privilege Access Management tab shows you the current pending Administrator requests (which you can approve or deny), as well as a history of previous requests. If provided, the reason can also be seen for each request, as well as the time, type, and username of the requester. The Generate local token button allows you to generate a 60-second token that can be used by the user to be allowed to request an Administrator elevation.
In the Pending Approvals view, administrators can refine elevation requests based on type, including Session, File, IASME Session, IASME File or non‑elevated executions, as well as by request status, such as Requested, Awaiting elevation, Awaiting file elevation, or requests restricted due to risk conditions. The integrated search functionality allows quick identification of entries using criteria such as active username or the reason provided for the request.
In the History view, filtering is available based on elevation type, including Session, File, IASME Session, IASME File or non‑elevated executions, while the search functionality allows administrators to locate records using selectable criteria such as active username, reason, executed process, or the user who handled the request.
These capabilities enhance traceability and enable faster analysis of elevation activity directly at endpoint level.
APPLICATION CONTROL
The Application Control tab lets you filter and manage the processes that are allowed to run. Here, you can manually allow or block any detected processes.
-
Full Logging
This view shows all the processes that are intercepted on the endpoint with the following details: Process Name, Number of Executions, Publisher, Software Name, Version, MD5, Status, and Timestamp.
A process that has been intercepted by Application Control will be displayed 24 hours after the initial interception. An already-intercepted process will have its status refreshed in real-time. -
Matching Allowed Rules
This view shows all the processes that are intercepted and allowed on the endpoint with the following details: Process Name, Number of Executions, Publisher, Software Name, Version, MD5, Status, and Timestamp. -
Matching Blocked Rules
This view shows all the processes that are intercepted and blocked on the endpoint with the following details: Process Name, Number of Executions, Publisher, Software Name, Version, MD5, Status, and Timestamp.
-
Matching Allowed with Auto Elevation
This view shows all the processes that are intercepted and allowed with Auto Elevation on the endpoint with the following details: Process Name, Number of Executions, Publisher, Software Name, Version, MD5, Status, and Timestamp.
-
Raw data
This view shows all the processes that are intercepted in real-time on the endpoint with the following details: Process Name, Number of Executions, Publisher, Software Name, Version, MD5, Status, and Timestamp.
If the Ruleset Mode has been set to Reporting Only, processes detected by Application Control will be listed under the Status column with an info bubble containing the tag "R" signifying that the process is being reported but no action is taken.
The Search field allows you to search among the processes by Process Name, Publisher, Software Name, and MD5. The Hide Microsoft Application allows you to display or hide Microsoft processes.
COMPLIANCE VIEW
The Compliance View tab lets you view active users on the machine, together with the domain and groups they belong to, as well as whether they are Administrators or not.
ZERO-TRUST EXECUTION PROTECTION
The Zero-Trust Execution Protection views will log the activity of this product. Here you can see the process and its MD5 hash, the username it ran from, and the timestamp. If you select one or more entries, you can also exclude them or upload them for analysis.
REMOTE DESKTOP
HISTORY
The Remote Desktop category allows you to view a history of remote sessions performed on a specific machine. The information included shows the hostname the connection was made between, the duration, and the type of the session.
RECORDINGS
The Recordings view will show all the recordings of remote sessions performed if those were chosen to be saved. Here you can view the hostname of the machine the recording was saved on, the filename of the recording, its timestamp, and the password.
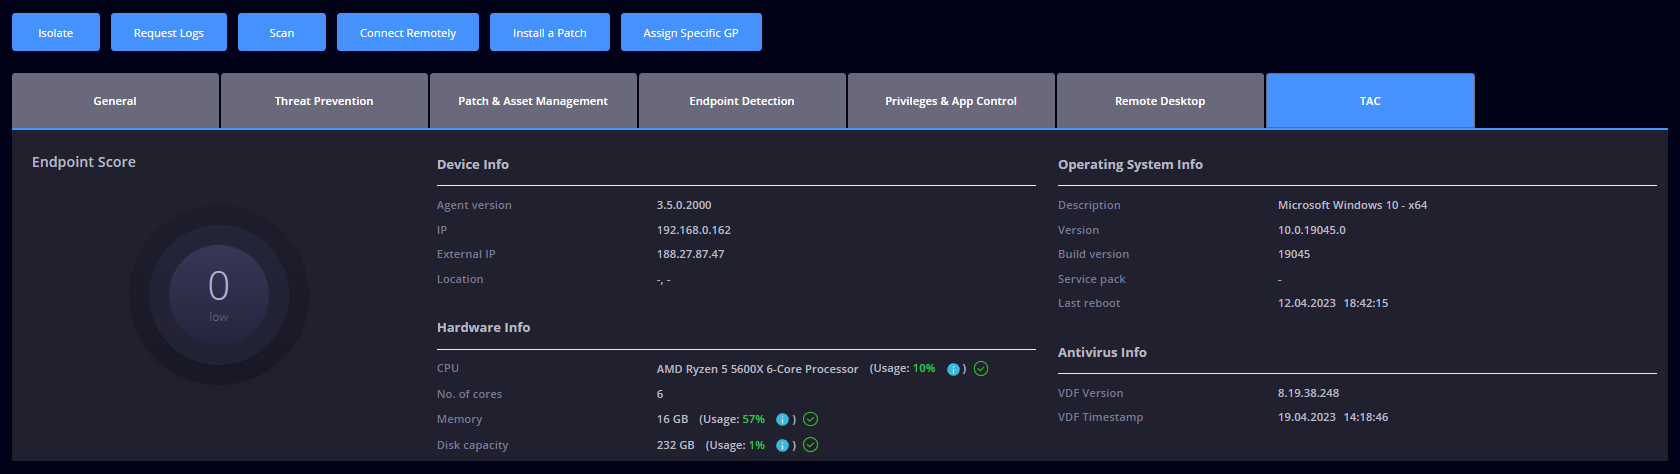
TAC
The TAC tab provides us with information about events for every endpoint happening in your organization, collecting and displaying them here.
In the TAC view, you have the Device Info which displays the (agent version, IP, external IP, location), Hardware Info (CPU, no. of cores, memory, disk capacity), Operating System Info (description, version, build version, service pack, last reboot), Antivirus Info (VDF version, VDF timestamp).
RISK CHART
The Risk Chart tab provides the user a spider diagram with score details per product like risk score and top detection. Below you can see two examples with different information if those small dots are clicked on: